 Quality Assurance Cihan University – Erbil
Related Articles


In accordance with the Quality Assurance framework, the results of the Quality Assurance evaluations at Cihan University–Erbil for the academic year 2023–2024 have been comprehensively analyzed and documented. The analysis covers all three evaluation categories (CAD, SF, and PF) at both the university-wide and departmental levels.
A detailed analytical and graphical assessment has been conducted, supported by quantitative data and statistical percentages. The report systematically identifies performance indicators, highlighting areas of strength as well as aspects requiring improvement within each department across the three evaluation dimensions.
This approach ensures transparency, evidence-based assessment, and alignment with national quality assurance standards and continuous institutional development objectives.
| ID | Departments | Average Score of Student Feedback (SF) | Average Score of teacher portfolios (PF) | Average Score of continuous academic development (CAD) |
| 1 | Accounting | 3.55 | 3.99 | 27.75 |
| 2 | Anesthesia Technologies | 1.66 | 2.98 | 37.14 |
| 3 | Architectural Engineering | 3.78 | 4.05 | 4.75 |
| 4 | Biomedical Sciences | 3.53 | 3.94 | 52.93 |
| 5 | Business Administration | 3.61 | 4.12 | 77.90 |
| 6 | Civil Engineering | 4.02 | 3.47 | 41.50 |
| 7 | Communication and Computer Engineering | 3.91 | 4.27 | 63.33 |
| 8 | Community Health Nursing | 2.70 | 1.65 | 13.71 |
| 9 | Computer Science IT | 3.57 | 3.31 | 76.78 |
| 10 | Dentistry | 3.25 | 3.50 | 33.00 |
| 11 | English Language | 3.86 | 3.87 | 79.43 |
| 12 | General Education | 3.65 | 3.46 | 43.88 |
| 13 | Graphic Design | 3.84 | 3.75 | 50.00 |
| 14 | Informatic and Software Engineering | 4.04 | 4.19 | 87.20 |
| 15 | International Relations and Diplomacy | 3.54 | 3.93 | 18.17 |
| 16 | Law | 2.03 | 3.56 | 24.64 |
| 17 | Media | 3.99 | 2.72 | 17.13 |
| 18 | Medical Biochemical Analysis | 2.97 | 3.50 | 38.00 |
| 19 | Medical Laboratory Analysis | 3.51 | 3.01 | 19.40 |
| 20 | Medical Microbiology | 2.76 | 3.58 | 44.50 |
| 21 | Nutrition and Dietetics | 4.04 | 1.22 | 16.60 |
| 22 | Pharmacy | 3.92 | 3.27 | 70.00 |
| 23 | Physical Education and Sport Science | 3.74 | 3.69 | 14.50 |
| 24 | Physiotherapy | 3.01 | 3.26 | 33.20 |
| 25 | Public Administration | 3.06 | 2.81 | 13.88 |
| 26 | Radiological Imaging Technologies | 3.44 | 3.76 | 47.57 |
| 27 | Translation | 4.03 | 4.07 | 62.00 |
The Quality Assurance evaluation assessed 27 academic departments using three key performance indicators:
- Student Feedback (SF)
- Teacher Portfolios (PF)
- Continuous Academic Development (CAD)
The results show generally strong performance across most departments, with some variations that highlight areas of excellence and opportunities for improvement.
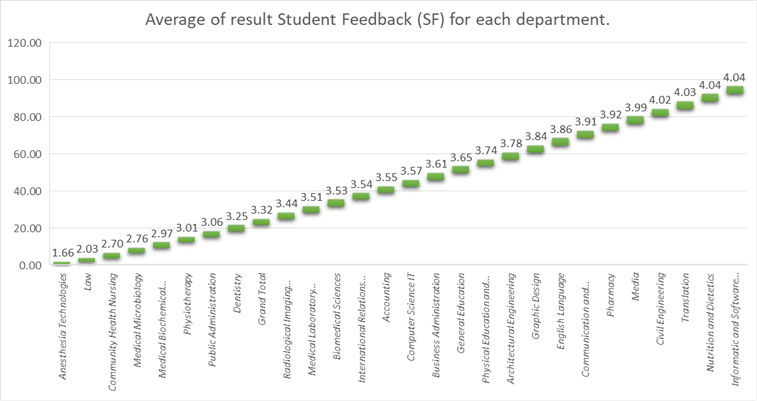
- Student Feedback (SF)
- Highest Scores:
- Informatic & Software Engineering (4.04)
- Nutrition & Dietetics (4.04)
- Translation (4.03)
- Civil Engineering (4.02)
- Lowest Scores:
- Anesthesia Technologies (1.66)
- Law (2.03)
- Community Health Nursing (2.70)
Observation:
Most departments scored between 3.0 and 4.0, indicating generally positive student satisfaction. However, a few departments require focused improvement in teaching quality, student engagement, or learning support.
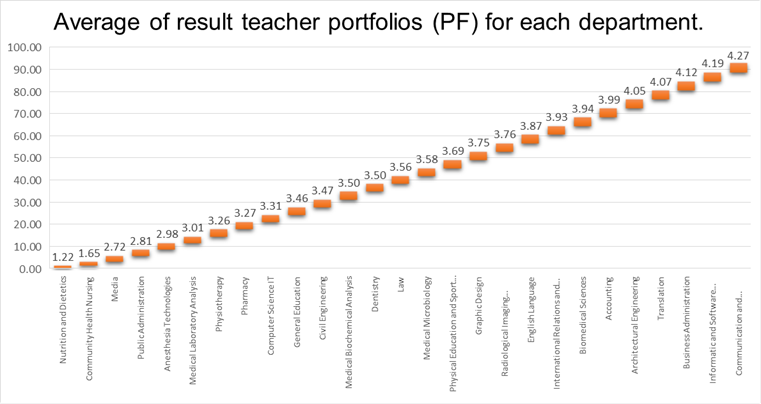
- Teacher Portfolios (PF)
- Highest Scores:
- Communication & Computer Engineering (4.27)
- Informatic & Software Engineering (4.19)
- Business Administration (4.12)
- Translation (4.07)
- Architectural Engineering (4.05)
- Lowest Scores:
- Nutrition & Dietetics (1.22)
- Community Health Nursing (1.65)
- Media (2.72)
- Public Administration (2.81)
Observation:
Most departments performed well in portfolio evaluation, demonstrating strong documentation of teaching, research, and academic activities. However, certain departments show significant gaps in portfolio development and documentation practices.
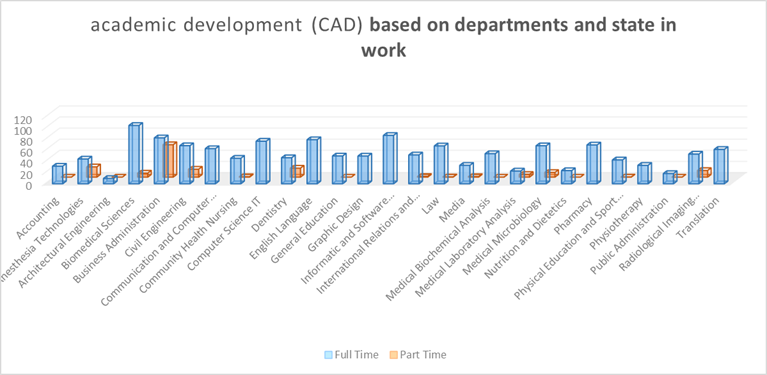
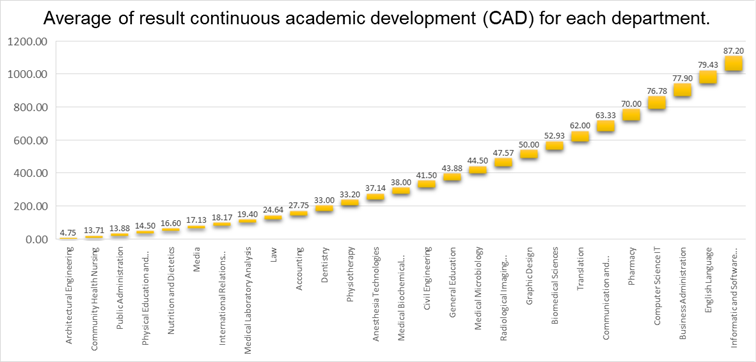
- Continuous Academic Development (CAD)
- Highest Scores:
- Informatic & Software Engineering (87.20)
- English Language (79.43)
- Business Administration (77.90)
- Computer Science IT (76.78)
- Pharmacy (70.00)
- Lowest Scores:
- Architectural Engineering (4.75)
- Media (17.13)
- Nutrition & Dietetics (16.60)
- Physical Education & Sport Science (14.50)
- Public Administration (13.88)
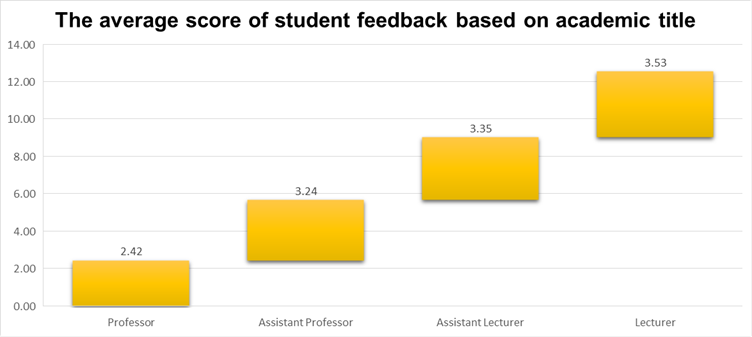
- Student Feedback by Academic Title
| Academic Title | Average Score |
| Professor | 2.42 |
| Assistant Professor | 3.24 |
| Assistant Lecturer | 3.35 |
| Lecturer | 3.53 |
- Lecturers received the highest average feedback score (3.53).
- Feedback scores decrease as academic rank increases.
- Professors received the lowest score (2.42).
Students appear to rate instructors with lower academic ranks more positively. This may reflect greater interaction, accessibility, or teaching engagement among lecturers and assistant lecturers.
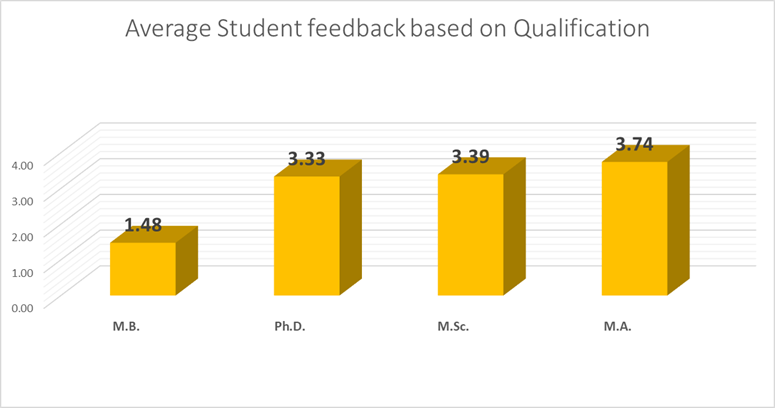
- Student Feedback by Academic Qualification
| Qualification | Average Score |
| M.B. | 1.48 |
| Ph.D. | 3.33 |
| M.Sc. | 3.39 |
| M.A. | 3.74 |
- M.A. holders received the highest feedback score (3.74).
- M.Sc. and Ph.D. holders received similar moderate scores.
- M.B. holders received the lowest score (1.48), significantly below others.
Higher feedback ratings are associated with M.A. qualifications, possibly reflecting strong teaching-focused backgrounds. The low score for M.B. holders may require further review and support.
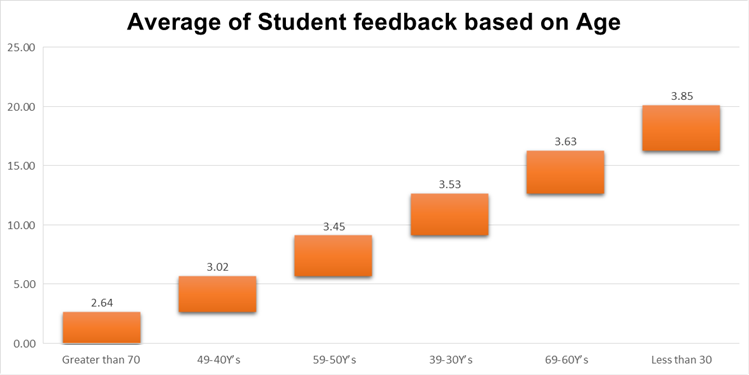
- Student Feedback by Age
| Age Group | Average Score |
| Less than 30 | 3.85 |
| 30–39 | 3.53 |
| 40–49 | 3.02 |
| 50–59 | 3.45 |
| 60–69 | 3.63 |
| Greater than 70 | 2.64 |
- Faculty under 30 received the highest feedback (3.85).
- Faculty over 70 received the lowest score (2.64).
- Generally, younger faculty tend to receive higher evaluations.
Younger instructors may demonstrate teaching styles, communication methods, or technological engagement that align more closely with student expectations.
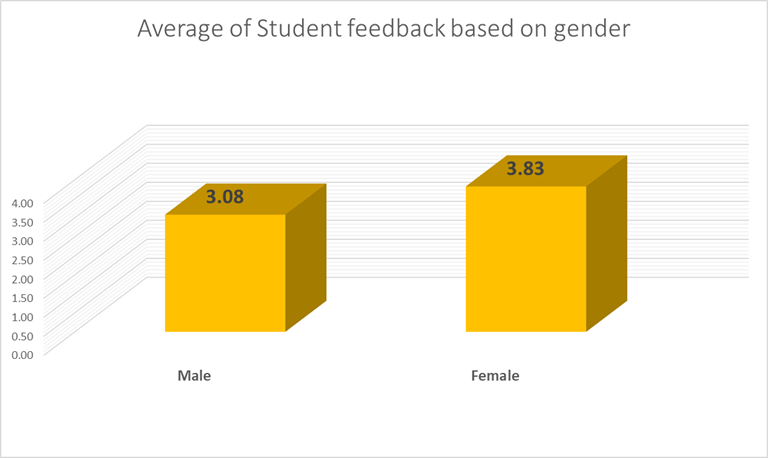
- Student Feedback by Gender
| Gender | Average Score |
| Male | 3.08 |
| Female | 3.83 |
- Female faculty members received higher feedback scores (3.83) compared to male faculty (3.08).
The difference suggests that female instructors may demonstrate teaching approaches or communication styles that are particularly well received by students.
- Overall Conclusions
- Student feedback tends to be higher for:
- Lecturers and Assistant Lecturers
- M.A. degree holders
- Younger faculty members
- Female instructors
- Lower feedback scores were observed among:
- Professors
- M.B. qualification holders
- Faculty over 70
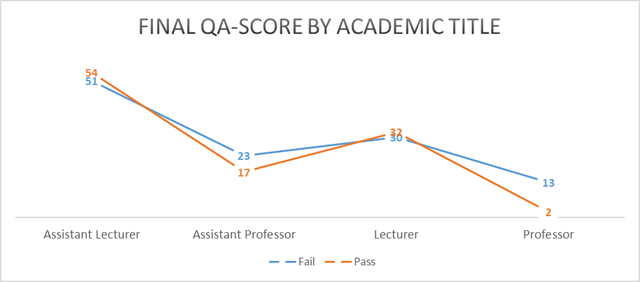
9. QA Results by Academic Title
| Title | Fail | Pass | Total | Pass % | Fail % |
| Assistant Lecturer | 51 | 54 | 105 | 51.4% | 48.6% |
| Assistant Professor | 23 | 17 | 40 | 42.5% | 57.5% |
| Lecturer | 30 | 32 | 62 | 51.6% | 48.4% |
| Professor | 13 | 2 | 15 | 13.3% | 86.7% |
- Lecturers (51.6%) and Assistant Lecturers (51.4%) show balanced but slightly positive performance.
- Assistant Professors demonstrate moderate concern with a 57.5% failure rate.
- Professors show the highest concern, with 86.7% failing and only 13.3% passing.
Strength:Mid-level academic staff (Lecturer and Assistant Lecturer) show relatively stable performance.
Weakness:Senior academic staff (especially Professors) require immediate quality review and corrective measures.
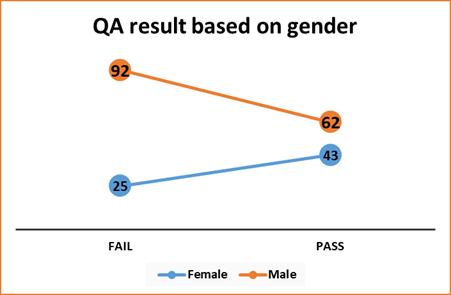
10. QA Results by Gender
| Gender | Fail | Pass | Total | Pass % | Fail % |
| Female | 25 | 43 | 68 | 63.2% | 36.8% |
| Male | 92 | 62 | 154 | 40.3% | 59.7% |
- Female staff demonstrate strong performance with a 63.2% pass rate.
- Male staff show higher failure rates (59.7%), significantly affecting the overall institutional result.
Strength:Female academic staff represent a performance strength indicator.
Weakness:Male staff performance requires structured improvement planning and monitoring.
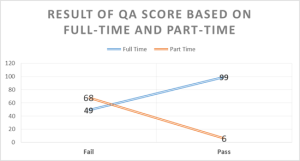
11. QA Results by Employment Status
| Status | Fail | Pass | Total | Pass % | Fail % |
| Full Time | 49 | 99 | 148 | 66.9% | 33.1% |
| Part Time | 68 | 6 | 74 | 8.1% | 91.9% |
- Full-time staff show strong performance (66.9% pass rate).
- Part-time staff show critical weakness, with a 91.9% failure rate.

12. Comparative Analysis
- The strongest performing group: Full-Time Staff (66.9% pass).
- The weakest performing group: Part-Time Staff (91.9% fail).
- Gender analysis shows a clear performance gap favoring female staff.
- Senior academic rank (Professor level) presents unexpected performance weakness.
13. Formal Report Paragraph (Accreditation Language)
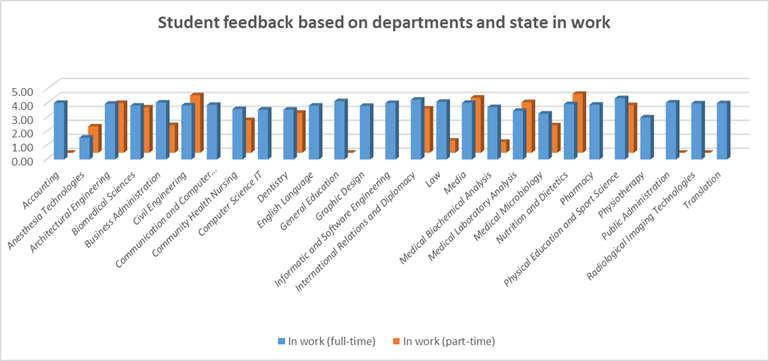
An institutional analysis of Student Feedback, Teacher Portfolios (PF), and Continuous Academic Development (CAD) across departments indicates consistently strong academic performance. Student feedback scores range approximately between 3.5 and 4.5 out of 5, reflecting high levels of student satisfaction across disciplines. Full-time faculty and students demonstrate slightly higher and more stable performance indicators compared to part-time counterparts.
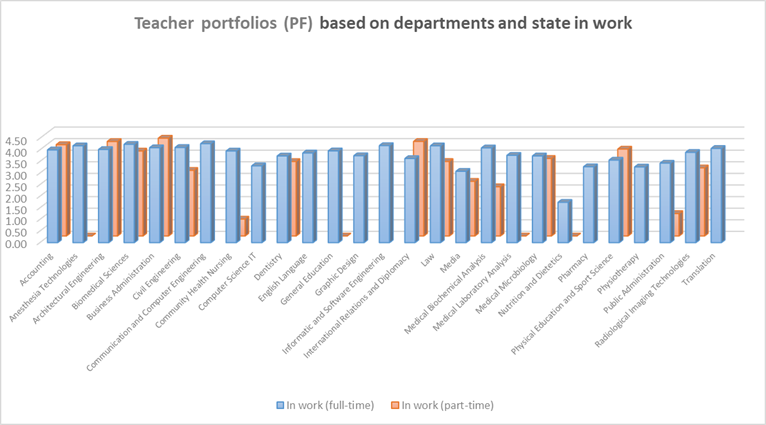
Teacher Portfolio evaluations similarly show strong academic compliance and documentation standards, with most departments maintaining performance levels above 4.0/5. This reflects effective instructional planning, assessment alignment, and quality assurance practices.
Academic Development (CAD) participation demonstrates higher variability across departments; however, full-time faculty engagement is significantly stronger, indicating a solid institutional research and professional development culture. The observed gap in part-time engagement suggests an opportunity for strategic enhancement.
Overall, the institution demonstrates strong teaching effectiveness, positive student satisfaction, and robust academic quality assurance mechanisms, aligned with institutional performance standards and continuous improvement frameworks.
| Indicator | Overall Performance | Full-Time | Part-Time | Institutional Status |
| Student Feedback | High (≈4.0/5) | Strong & Consistent | Moderate–High | Very Good |
| Teacher Portfolio (PF) | High (≈4.1/5) | Strong | Slightly Lower | Very Good |
| Academic Development (CAD) | Variable | High Engagement | Lower Engagement | Needs Targeted Improvement |
🔹 Institutional Strengths
- Consistently high student satisfaction across departments.
- Strong portfolio documentation and teaching quality assurance.
- High academic development engagement among full-time staff.
- Performance stability across Engineering, Medical, and Health-related departments.
🔹 Areas for Strategic Enhancement
- Increase part-time faculty engagement in academic development.
- Reduce performance variability in selected departments.
- Strengthen research and professional training participation for non-full-time staff.
14. Statistical Interpretation (Estimated from Chart Visualization)
Student Feedback
- Average estimated score: ~4.0/5 (≈80%)
- Full-time average: ~4.2/5 (≈84%)
- Part-time average: ~3.6–3.8/5 (≈72–76%)
- Estimated performance gap: 6–10% difference
Teacher Portfolio (PF)
- Overall average: ~4.1/5 (≈82%)
- Full-time: ~4.2–4.4 (≈84–88%)
- Part-time: ~3.5–4.0 (≈70–80%)
- Performance consistency across most departments.
Academic Development (CAD)
- Full-time participation appears approximately 2–3 times higher than part-time in many departments.
- Estimated institutional engagement distribution:
- Full-time contribution: ~70–75%
- Part-time contribution: ~25–30%
- Highest engagement observed in scientific and health-related departments.