 Quality Assurance Cihan University – Erbil
Related Articles


1- Introduction
This report presents a statistical analysis of three academic performance indicators across 27 university departments:
- SF – Student Feedback
- PF – Teacher Portfolios
- CAD – Continuous Academic Development
The data reveal noticeable variations among departments. While most departments demonstrate strong performance in Student Feedback and Teacher Portfolios, Continuous Academic Development scores show wider disparities, indicating differences in research productivity and professional development engagement. Some departments maintain balanced performance across all indicators, whereas others show strengths in specific areas but require improvement in academic development or instructional effectiveness.
This comparative evaluation provides valuable insight for academic planning, quality assurance, and strategic decision-making. By identifying high-performing departments and those requiring targeted support, university leadership can enhance institutional quality, promote academic excellence, and ensure continuous improvement across all academic units.
| ID | Department | Average SF | Average PF | Average CAD |
| 1 | Accounting | 4.04 | 2.51 | 48.70 |
| 2 | Anesthesia Technologies | 4.06 | 3.07 | 37.80 |
| 3 | Architectural Engineering | 3.18 | 2.59 | 31.75 |
| 4 | Biomedical Sciences | 3.00 | 2.02 | 18.06 |
| 5 | Business Administration | 3.58 | 3.22 | 76.56 |
| 6 | Civil Engineering | 1.57 | 1.85 | 0.00 |
| 7 | Community Health Nursing | 3.71 | 3.83 | 41.67 |
| 8 | Computer Science IT | 3.32 | 2.60 | 41.00 |
| 9 | Dentistry | 3.74 | 3.26 | 55.47 |
| 10 | English Language | 3.25 | 2.90 | 40.80 |
| 11 | General Education | 3.88 | 3.39 | 62.00 |
| 12 | Graphic Design | 3.58 | 2.53 | 31.75 |
| 13 | Informatic and Software Engineering | 3.97 | 3.31 | 34.73 |
| 14 | Interior Design Engineering | 2.71 | 2.61 | 0.00 |
| 15 | International Relations and Diplomacy | 3.81 | 2.95 | 13.83 |
| 16 | Law | 3.90 | 3.63 | 27.08 |
| 17 | Media | 3.95 | 2.25 | 36.20 |
| 18 | Medical Biochemical Analysis | 3.24 | 2.55 | 30.68 |
| 19 | Medical Laboratory Analysis | 3.35 | 3.68 | 38.11 |
| 20 | Medical Microbiology | 3.20 | 2.30 | 27.77 |
| 21 | Nutrition and Dietetics | 3.29 | 3.43 | 38.18 |
| 22 | Pharmacy | 3.48 | 3.44 | 44.83 |
| 23 | Physical Education and Sport Science | 4.13 | 3.20 | 7.22 |
| 24 | Physiotherapy | 3.87 | 3.76 | 28.89 |
| 25 | Public Administration | 3.51 | 3.24 | 78.88 |
| 26 | Radiological Imaging Technologies | 3.43 | 3.14 | 40.60 |
| 27 | Translation | 3.62 | 3.36 | 52.00 |
2- Descriptive Statistical Analysis for SF, PF and CAD
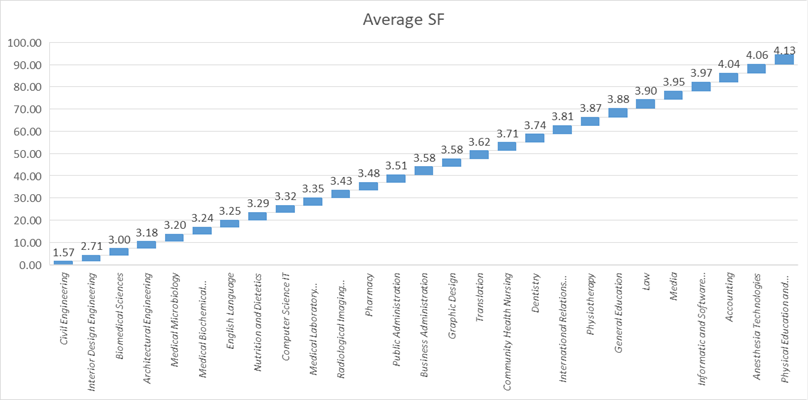
🔹 A. Student Feedback (SF)
- Highest SF: 4.13 (Physical Education & Sport Science)
- Second Highest: 4.06 (Anesthesia Technologies)
- Lowest SF: 1.57 (Civil Engineering)
- Range: 1.57 – 4.13
- Overall Pattern: Majority of departments score between 3.20 – 4.00
- Overall student satisfaction is high.
- Only one significant outlier (Civil Engineering).
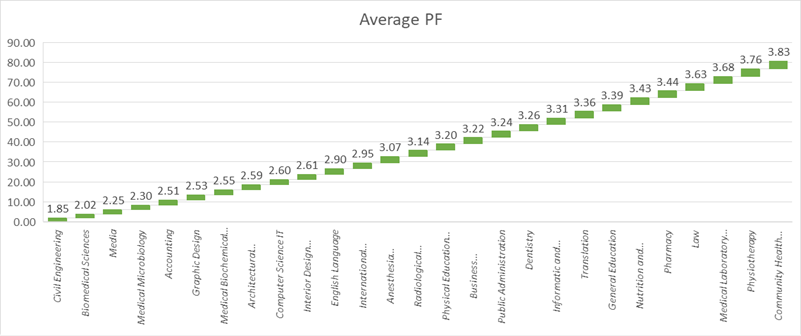
🔹 B. Teacher Portfolios (PF)
- Highest PF: 3.83 (Community Health Nursing)
- Second Highest: 3.76 (Physiotherapy)
- Lowest PF: 1.85 (Civil Engineering)
- Range: 1.85 – 3.83
- PF scores show moderate variation.
- Most departments cluster between 2.50 – 3.60.
- Civil Engineering again shows lowest performance.
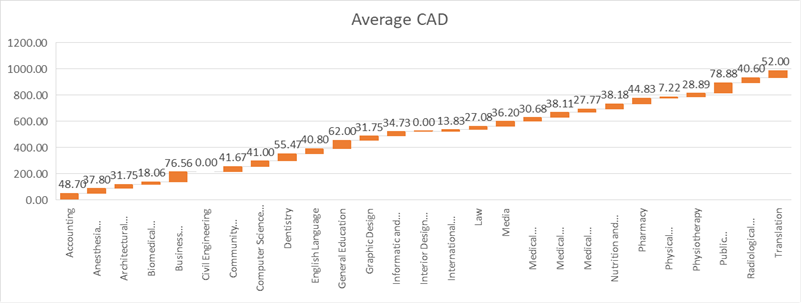
🔹 C. Continuous Academic Development (CAD)
- Highest CAD: 78.88 (Public Administration)
- Second Highest: 76.56 (Business Administration)
- Third Highest: 62.00 (General Education)
- Lowest CAD: 0.00
- Civil Engineering
- Interior Design Engineering
- Range: 0 – 78.88
- CAD shows the largest performance gap.
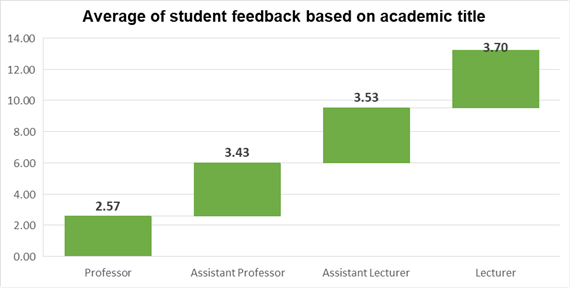
- Average Student Feedback Analysis by Academic Title
| Academic Title | Average Score |
| Professor | 2.57 |
| Assistant Professor | 3.43 |
| Assistant Lecturer | 3.53 |
| Lecturer | 3.70 |
- Highest score (Lecturer 3.70) vs Lowest score (Professor 2.57):
Ratio = 3.70 / 2.57 ≈ 1.44
→ Lecturers receive 44% higher feedback scores compared to Professors. - Assistant Lecturers score 37% higher than Professors.
- Feedback trend increases as academic rank decreases.
Interpretation:
Junior academic staff (Lecturer, Assistant Lecturer) receive comparatively higher student satisfaction ratings than senior faculty members.
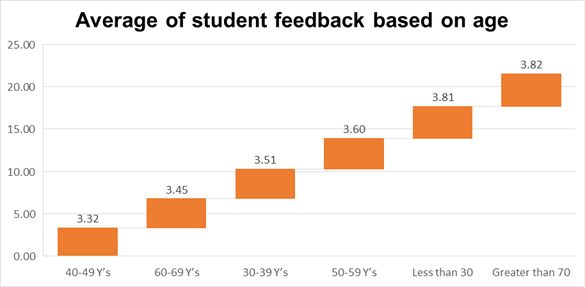
- Average Student Feedback Analysis by Age Group
| Age Group | Average Score |
| 40–49 | 3.32 |
| 60–69 | 3.45 |
| 30–39 | 3.51 |
| 50–59 | 3.60 |
| Less than 30 | 3.81 |
| >70 | 3.82 |
- Highest ( >70 = 3.82 ) vs Lowest (40–49 = 3.32)
Ratio = 3.82 / 3.32 ≈ 1.15
→ 15% variation only.
Interpretation:
Age impact is relatively moderate. However, the highest satisfaction appears among the youngest (<30) and oldest (>70) instructors.
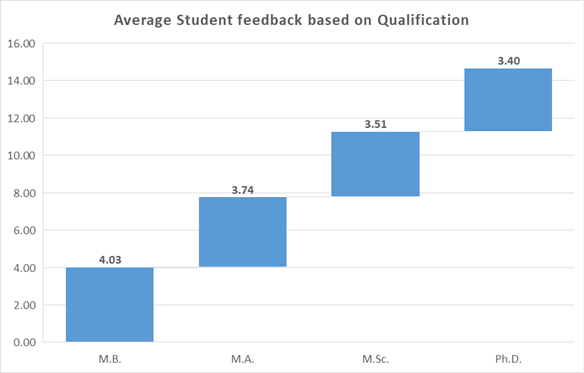
- Average Student Feedback Analysis by Qualification
| Qualification | Average Score |
| M.B. | 4.03 |
| M.A. | 3.74 |
| M.Sc. | 3.51 |
| Ph.D. | 3.40 |
- Highest (M.B. = 4.03) vs Lowest (Ph.D. = 3.40), Ratio = 4.03 / 3.40 ≈ 1.19
→ 19% higher feedback for M.B. holders.
Observation:
Higher academic qualification does not necessarily correlate with higher student satisfaction.
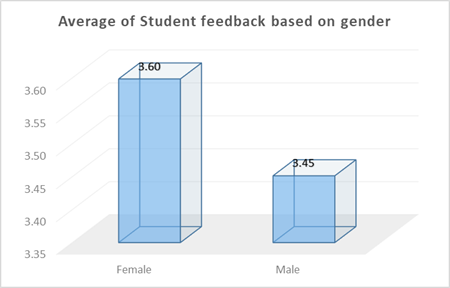
- Average Student Feedback Analysis by Gender
| Female | 3.60 |
| Male | 3.45 |
- 3.60 / 3.45 ≈ 1.04
→ Female staff receive 4% higher feedback on average.
Conclusion:
Gender difference is minimal but slightly favors female instructors.
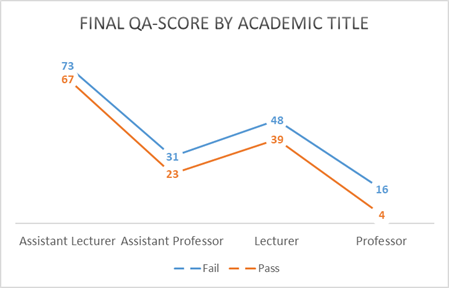
- Final QA-Score Analysis by Academic Title
| Title | Fail | Pass | Pass % |
| Assistant Lecturer | 73 | 67 | 47.9% |
| Assistant Professor | 31 | 23 | 42.6% |
| Lecturer | 48 | 39 | 44.8% |
| Professor | 16 | 4 | 20.0% |
- Professors have the lowest pass rate (20%).
- Assistant Lecturers show the highest pass performance (47.9%).
- Overall Fail-to-Pass ratio is highest among Professors (4:1).
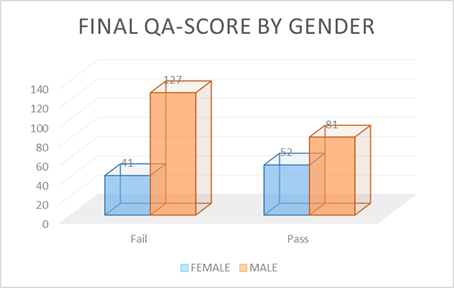
- Final QA-Score Analysis by Gender
| Gender | Fail | Pass | Pass % |
| Female | 41 | 52 | 55.9% |
| Male | 127 | 81 | 38.9% |
- Female pass rate is 1.44 times higher than male pass rate. Male failure rate is significantly higher.
- Final QA-Score Analysis by Work Time
| Work Type | Fail | Pass | Pass % |
| Full Time | 63 | 135 | 68.2% |
| Part Time | 115 | 8 | 6.5% |
- Full-time staff pass rate is 10.5 times higher than part-time staff.
- Part-time failure rate extremely high (93.5%).
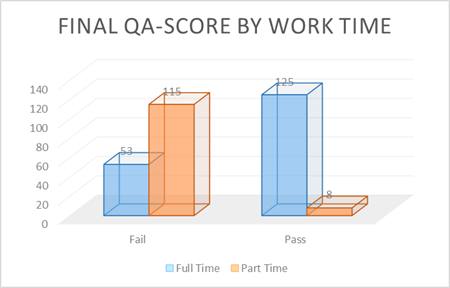
Major Finding:
Employment status (Full-time vs Part-time) has the strongest impact on QA results.
Overall Institutional Insights
- Strongest Performance Factor:
✔ Work status (Full-time employment significantly improves QA results)
- Moderate Impact Factors:
✔ Academic title
✔ Qualification
- Minor Impact Factors:
✔ Gender
✔ Age
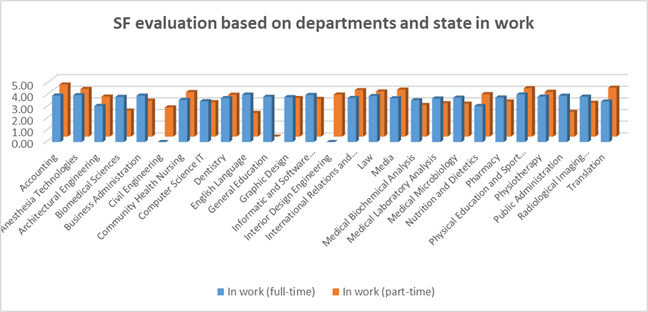
10. Student Feedback (SF) Evaluation
- Full-Time staff consistently demonstrate stable and higher SF averages across most departments.
- In several departments (e.g., Medical, Pharmacy, Engineering, and Administrative Sciences), part-time staff show greater variability in feedback scores.
- Departments with predominantly full-time staff display more consistent performance patterns.
Observations:
- Academic departments such as Medicine, Pharmacy, and Business Administration maintain relatively strong SF outcomes.
- Technical and engineering-related departments show moderate variation between employment categories.
- Departments with high reliance on part-time staff exhibit noticeable fluctuation in student satisfaction.
Institutional Implication:
Employment stability appears positively associated with student satisfaction outcomes. Departments with structured full-time staffing models demonstrate stronger consistency in instructional quality.
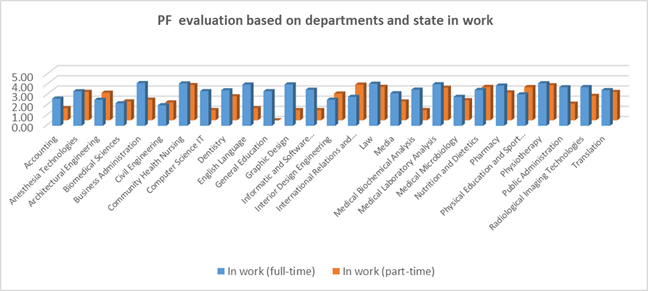
- Performance Factor (PF) Evaluation
Key Findings:
- Full-time staff outperform part-time staff in the majority of departments.
- PF variation is more pronounced in departments with higher operational or laboratory components.
- Some departments show close alignment between full-time and part-time PF scores, indicating balanced operational management.
Observations:
- Medical and health-related departments show relatively high PF values among full-time staff.
- Departments relying heavily on part-time instructors display wider performance gaps.
- Administrative and humanities departments demonstrate moderate performance stability.
Institutional Implication:
Performance outcomes correlate with employment commitment and institutional integration. Full-time staff appear more aligned with institutional KPIs and operational expectations.
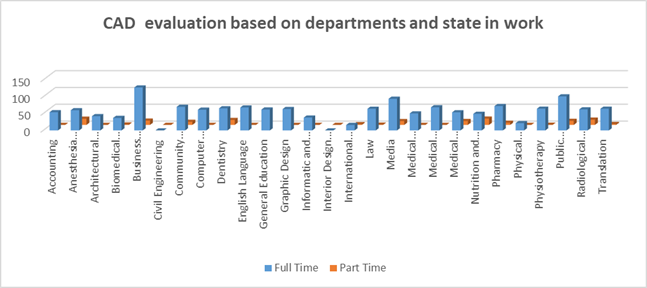
- CAD Evaluation
The CAD indicator demonstrates the most significant contrast between employment categories.
Key Findings:
- Full-time staff show substantially higher CAD values across nearly all departments.
- In several departments (e.g., Business Administration, Media, Public Administration), the difference between full-time and part-time staff is considerable.
- Part-time CAD values remain comparatively low in multiple academic units.
Critical Observation:
CAD variation represents the most significant institutional gap among the three indicators.
Institutional Implication:
Course planning, academic delivery consistency, and documentation compliance appear more effectively maintained by full-time staff. This suggests that workload distribution, academic engagement, and institutional integration influence performance outcomes.
- Cross-Indicator Comparative Insights
| Indicator | Stability (Full-Time) | Variability (Part-Time) | Institutional Risk Level |
| SF | High | Moderate | Medium |
| PF | High | Moderate–High | Medium |
| CAD | Very High | High | High |
Overall Trend:
- Full-time employment is positively associated with stronger institutional performance across all indicators.
- CAD shows the strongest dependency on employment status.
- Departments with balanced staffing structures demonstrate better quality assurance outcomes.
- Strategic Institutional Considerations
Based on the comparative analysis:
- Strengthen monitoring of part-time academic performance, particularly in CAD-related indicators.
- Enhance structured onboarding and QA orientation programs for part-time instructors.
- Promote institutional integration of part-time staff through academic committee participation and structured reporting mechanisms.
- Develop department-specific improvement plans where indicator gaps are highest.
- Integrate findings into the annual Continuous Quality Improvement (CQI) cycle and accreditation self-study documentation.